This activity is a demonstration on how to restore an image which is corrupted with a known degradation function such as motion blur and additive noise.
The image degradation and restoration process can be modeled by the diagram shown below.
A degradation function H along with an additive noise terms, n(x,y) operates on an input image f(x,y) producing a degraded image g(x,y). With the given g(x,y) and some knowledge about the degradation function H and additive noise terms n(x,y), we can obtain an estimate restoration f'(x,y) of the original image.
The degraded image is given in the spatial domain

Thus, it can be written in an equivalent frequency domain by getting the Fourier transforms of the corresponding terms.
So we need to have our original image to be transformed in the frequency domain. Now, we will start the degradation of an original image by having our degradation function that will cause the original image to blur. H(u,v) is the Fourier transform of the degradation function given by
where a and b is the total distance for which the image has been displaced in the x- and y- direction, correspondingly and T is the duration of the exposure from the opening and closing of the shutter in the imaging process. We will use a = b = 0.1 and T = 1 and investigate also on other values for these parameters.
The additive noise terms will also be transformed in frequency domain.
To restore these corrupted images, we will apply the Weiner filter expressed by
This expression is also commonly referred to as the minimum mean square error filter or the least square error filter. The terms on the expression are as follows:
This expression is very useful when the power spectrum of the noise and the original image are known. Things can be more simplified when we are dealing with spectral white noise (the power spectrum of the noise is constant). However, the power spectrum of the original image is not often known wherein another approach can be used with the expression
where K is a specified constant. This expression yields the frequency-domain estimate. The restored image must be in the spatial domain which will be obtain by taking the inverse Fourier transform of estimation.
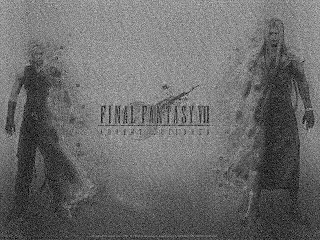
The image utilized for this activity is shown below
**Taken from: http://www.background-wallpapers.com/games-wallpapers/final-fantasy/final-fantasy-vii.html
The following images show the degradation of the original image with the corresponding parameters used. The first set of images has T = 1 and a = b = 0.001, 0.01, and 0.1.
Their corresponding restored images are also obtained and shown below.
We observed that by having small values of a and b, we are putting less blur on the image. Thus, its corresponding Weiner filtered image yields better image.
By keeping a and b constant, T was varied. (T = 0.01, 0.1, 10, and 100 )
Their respective restored image was shown below.
As observed, lesser exposure time makes the noise more obvious with constant values of a and b. On the contrary, greater exposure time will make the blur more visible. The Weiner filter, which works on the blur applied on the original image restores the image with higher exposure time much better.
For cases with unknown power spectrum of the original image, the constant K was varied with a = b = 0.01 and T = 1 . (K = 0.001, 0.01, 0.1 and 1, respectively)
Using a constant value of K shows a significant deviation on the restoration of the degraded image. It shows that knowing the power spectrum of the ungraded image as well as the power spectrum of the added noise is crucial in filtering blurred images. However, in instances that the two parameters are unknown, choosing a good value of K will yield a more enhanced image.
I will grade myself 9/10 for this activity. I was able to understand the activity and obtain the needed output given a short working time. However, I know that there are still so much to learn from this activity. I acknowledged Gilbert for helping me finish this activity.
The code below was use in implementing the Weiner filter on the degraded images.
image = gray_imread('FF7.bmp');
noise = grand(size(image,1), size(image,2), 'nor', 0.02, 0.02);
a = 0.01;
b = 0.01;
T = 1;
H = [];
for i = 1:size(image,1)
for j = 1:size(image,2)
H(i, j) = (T/(%pi*(i*a + j*b)))*(sin(%pi*(i*a + j*b)))*exp(-%i*%pi*(i*a + j*b));
end
end
F = fft2(image);
N = fft2(noise);
G = H.*F + N;
noisyblurredimage = abs(ifft(G));
scf(1);
imshow(noisyblurredimage, []);
imwrite(normal(noisyblurredimage), 'filename.bmp');
// Weiner filtering
Sn = N.*conj(N);
Sf = F.*conj(F);
K = Sn./Sf;
W = H.*conj(H);
Fres = ((1)./H).*((W)./(W+K)).*G;
Fres = abs(ifft(Fres));
scf(2);
imshow(Fres, []);
imwrite(normal(Fres), 'filename.bmp');


