Primarily, this activity aims to find the numerical values of a digitally scanned hand-drawn plot with the use of ratio and proportion.
First, I looked for a hand-drawn graph from an old journal and I found this plot from Annals of Chemistry, 1940.

This graph relates the carbon dioxide output from washed potato tubers under aerobic and anaerobic conditions.
I started noting down the pixel values of each data point by first having a conversion factor which relates the number of pixels to a certain number of physical value along both x and y axis.
For the x-axis, the ratio is 222:1 pixels and for the y-axis, there is 1440:1 pixels ratio. With these ratios in hand, I was able to tabulate the number of pixels of each data points and their equivalent physical values on each axis.

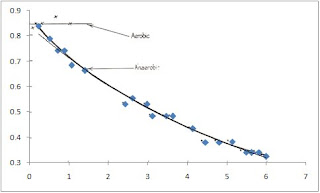
The plot above shows a decent reconstruction of the original graph. With the original graph being placed at the background of the reconstructed graph, we can see the correspondence among each data points with insignificant deviations. The trendline imposed on the reconstructed graph also fits the trendline of the original graph.
I evaluate myself with a grade of 10/10 from being able to find the numerical values of a hand-written graph by utilizing the ratio of number of pixels to number of physical value. I exerted enough effort to finish this activity on time. I also acknowledge the help of Raffy, Gilbert and Kaye in discussing the way on how to begin with the activity.

Nice work. 10 is deserved. But I think the comment button has the same color as the background. I can't see it.
ReplyDelete